2022 Q4 Creative Operations Report

Starting in early 2022 and culminating in the Q4 Creative Operations Report, we set out to see how in-house creative teams were evolving and restructuring. In our Q2 report we revealed that teams were facing key challenges. These included tight timelines, unclear or incomplete requests, and trouble keeping up with the volume of work. In Q3, we found that 3 out of 4 teams were restructuring. Efficiency was the main driver, with 37% of teams reporting that their ability to deliver work more rapidly was the top outcome.

If teams are restructuring to drive success, we had burning questions to ask. What metrics do those teams use to measure success? And how do teams use that data in decision-making? Our Q4 Creative Operations Report research was designed to explore these questions. Next to that, we also wanted to measure the organizational impact of tracking metrics. How do creative and marketing teams use them to make data-driven decisions?

43% of teams admitted that pulling metrics is still a cumbersome task.

Top Metrics Being Tracked By Creative Teams:
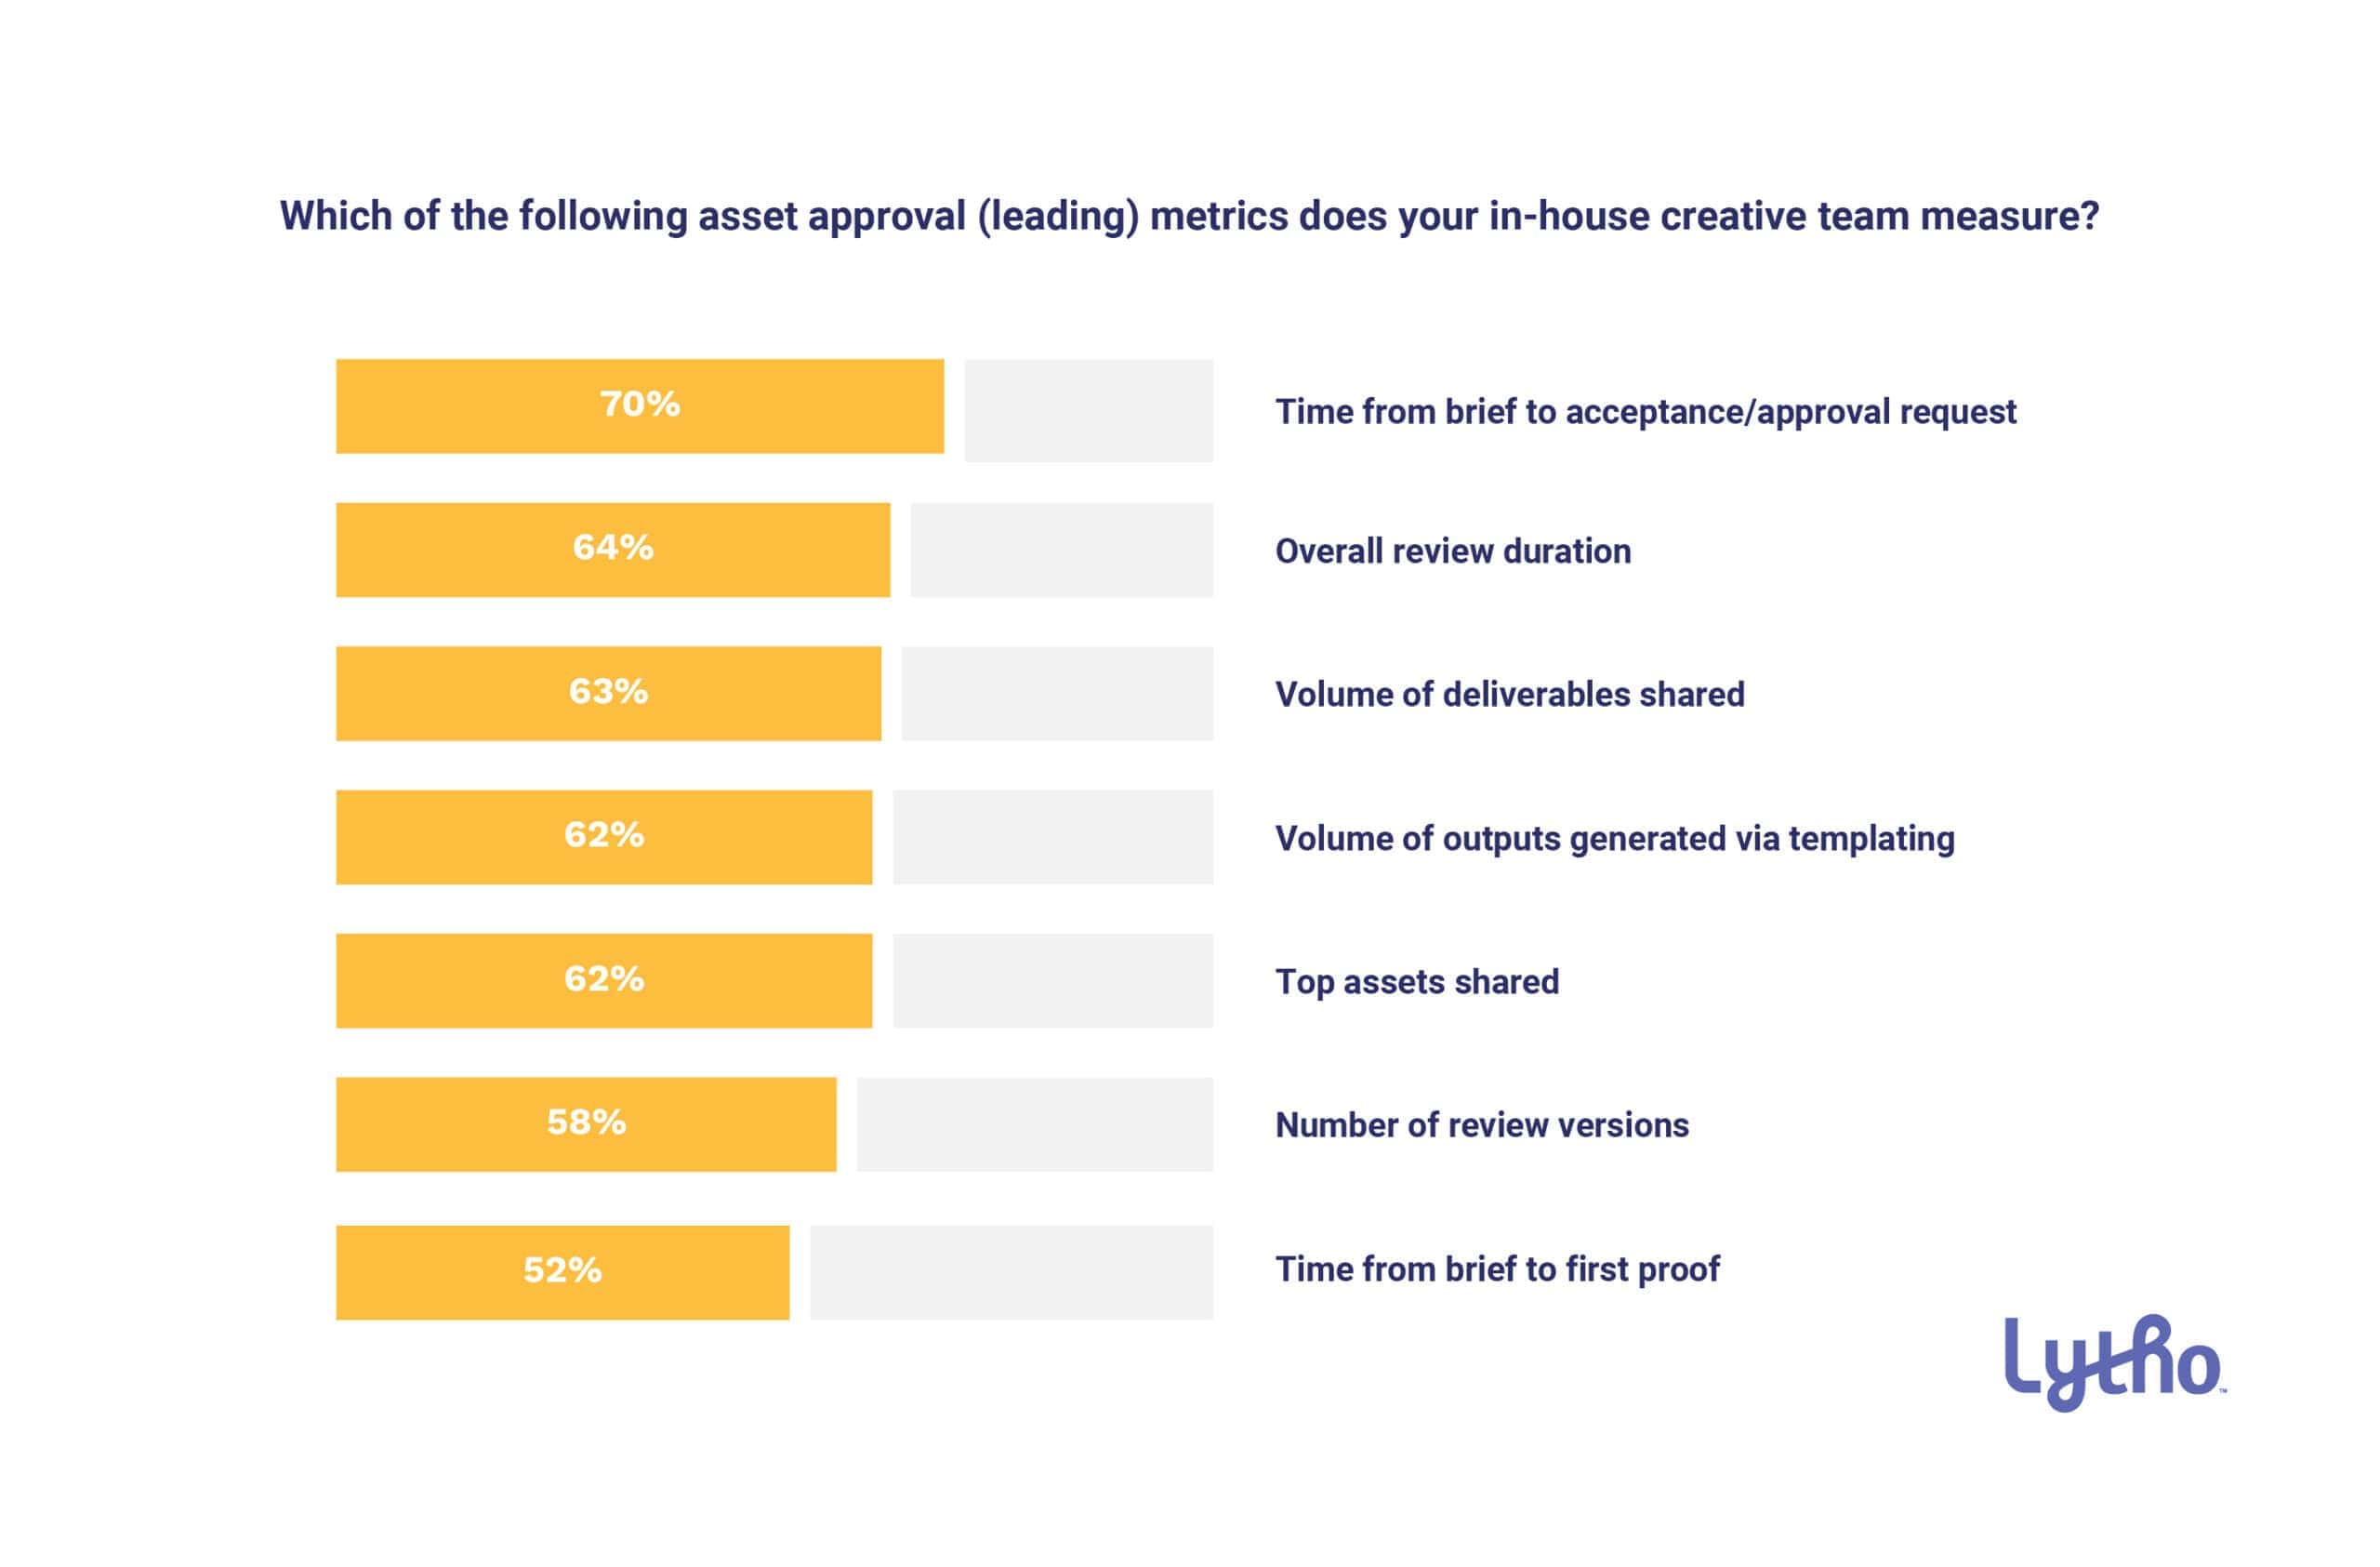
Leading Metrics:

  • Time from brief to acceptance

  • Overall review duration

  • Volume of deliverables shared
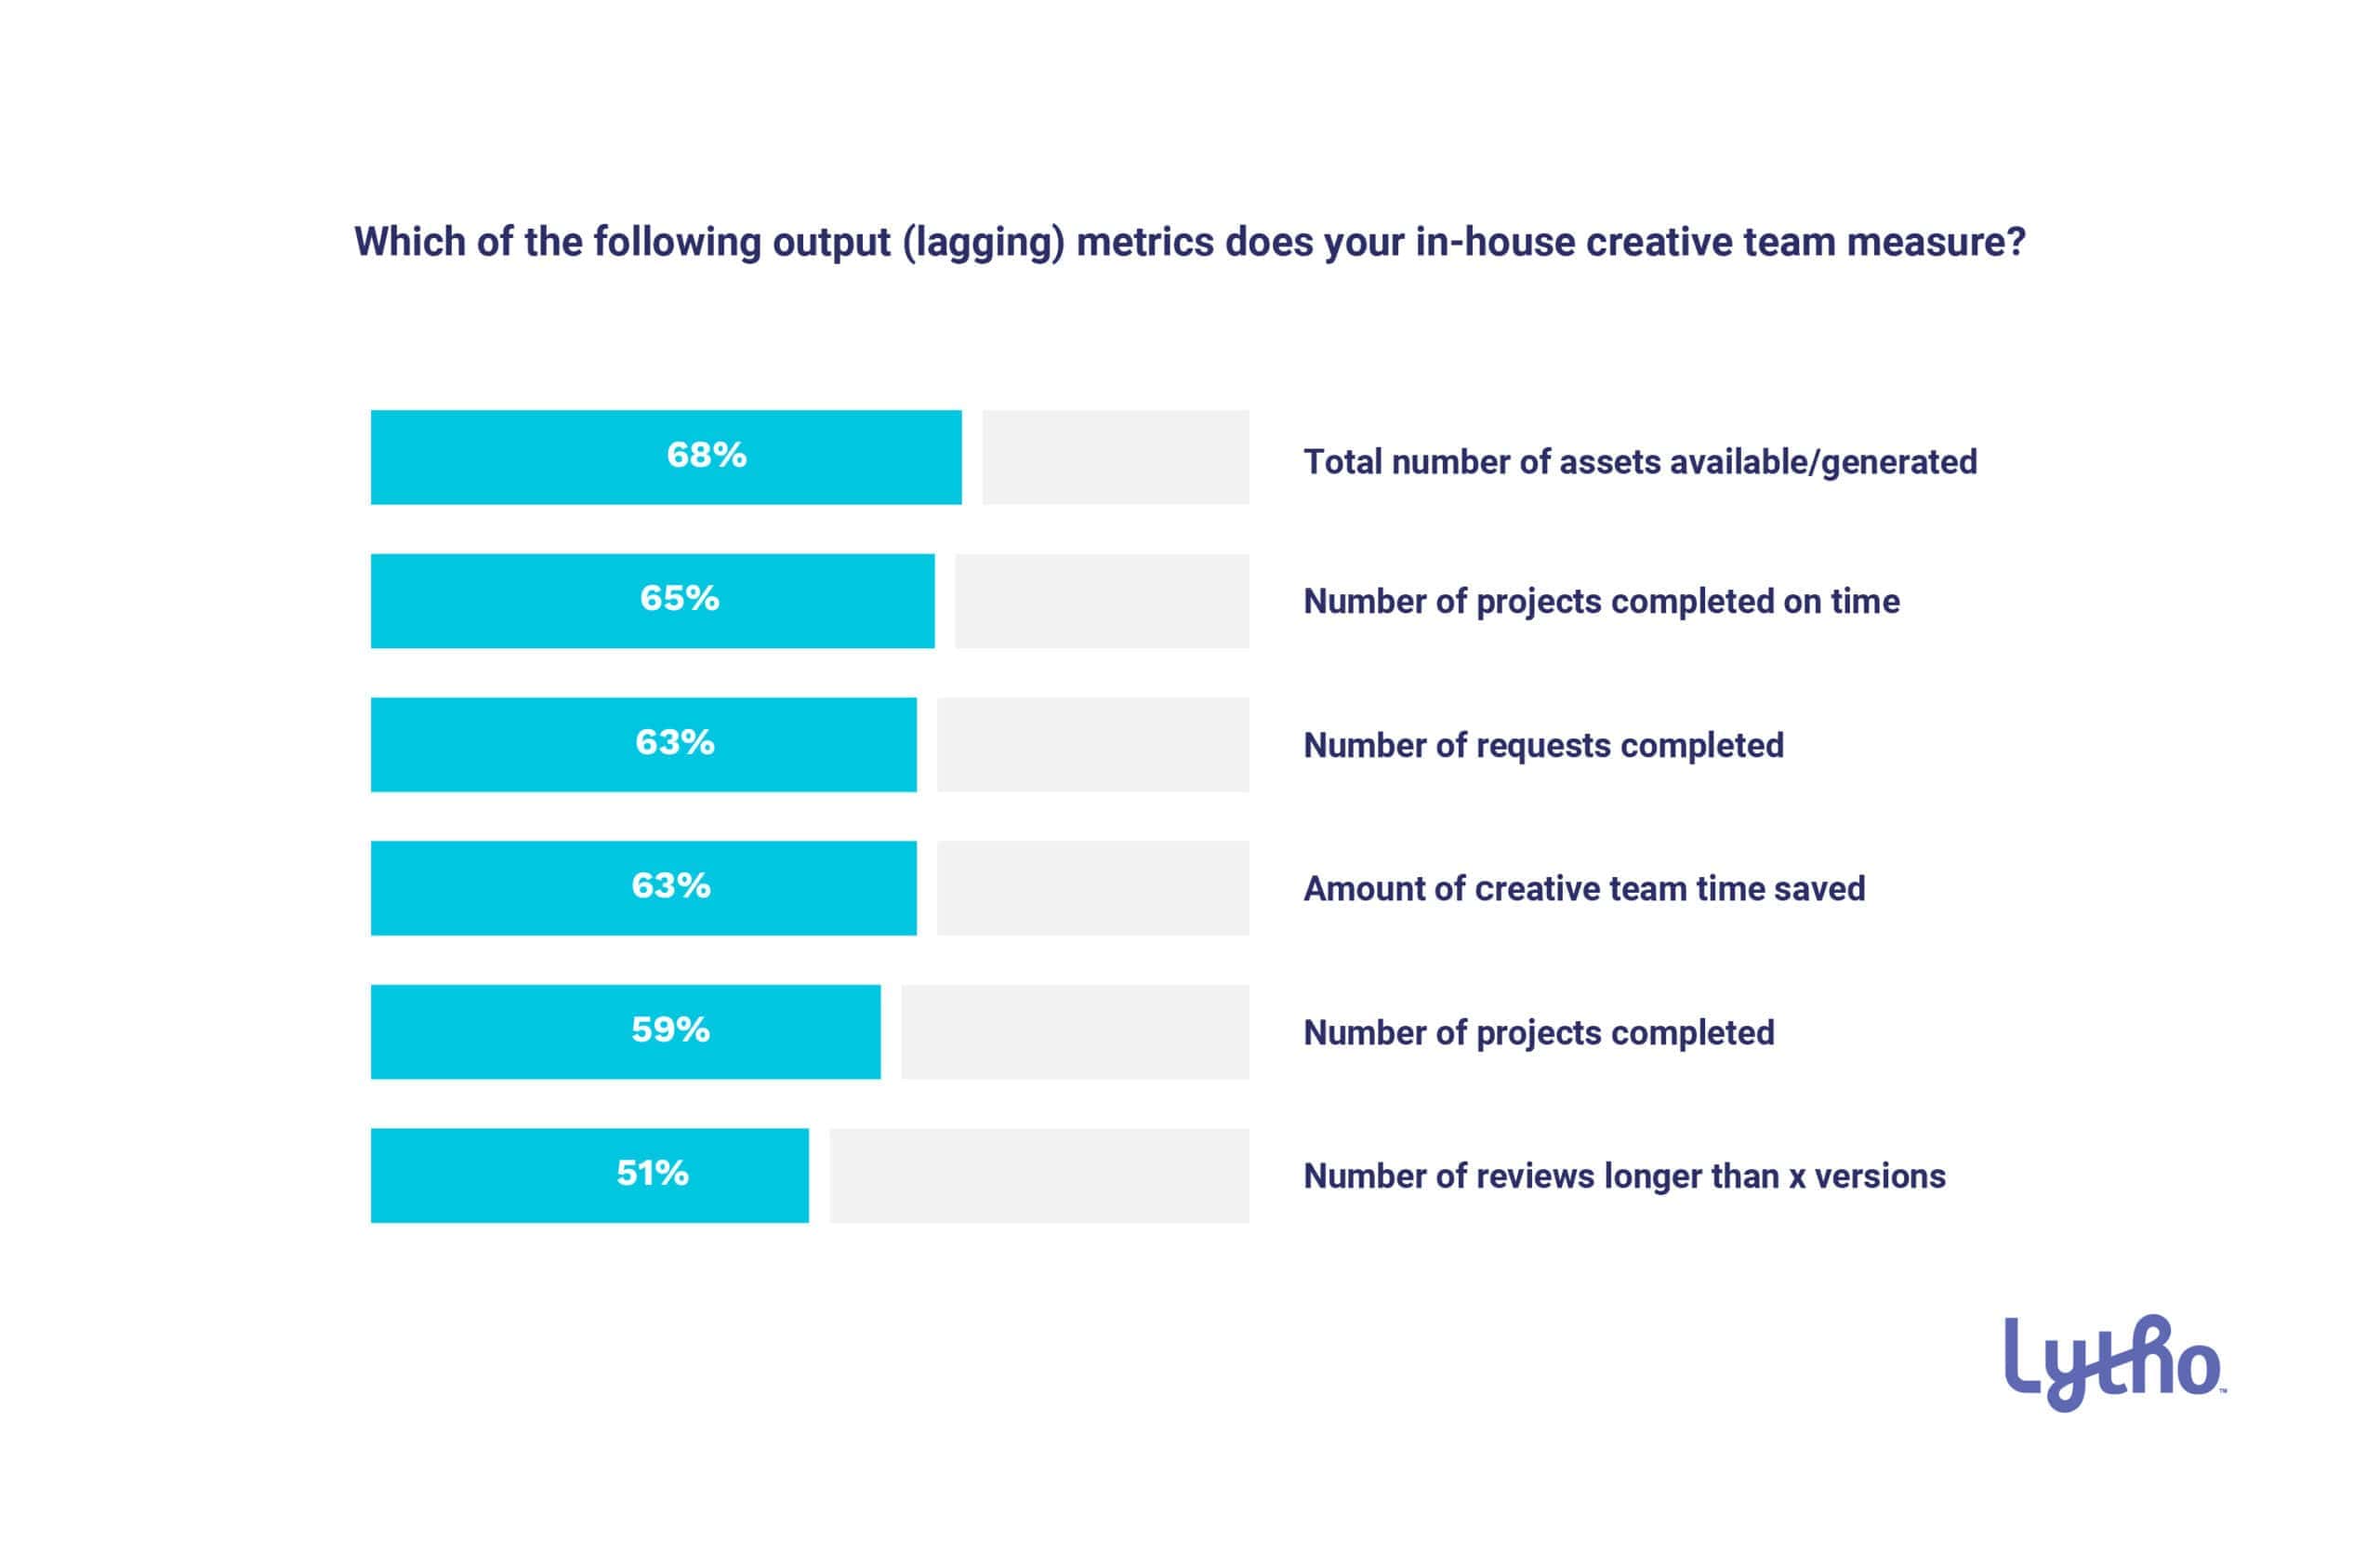
Lagging Metrics:

  • Number of requests completed

  • Number projects completed on time

  • Total number of assets available/generated

After surveying over 120 creative and marketing professionals, an overwhelming 95% report that they are tracking metrics.
However, 83% of respondents indicated that they started tracking metrics only in the past year. And 63% only starting in the last six months.
So, what has been the catalyst for teams that has led them to start tracking metrics now?
Teams want to show their work’s impact in a data-driven and tangible manner. As the pace of business increases and structural changes like remote work alter the landscape, that is how they can prove their value and impact in a way that might have been taken for granted just a few years ago. They are leveraging metrics to identify where process bottlenecks are and make improvements (76%). Not only that but they are using the data to build business cases for additional resources. And they do so whether it is through external agencies (72%) or adding headcount (67%).
Respondents have been overwhelmingly satisfied with the metrics their teams are tracking. More importantly, they believe that the team is using the data to make business decisions.
However, 43% of teams admitted that pulling metrics is still a cumbersome task. The reason behind this is they must gather information from multiple tools, which is often quite a manual process.
Throughout the Q4 creative operations report, we dig in on the top metrics being tracked – both leading and lagging indicators. We also lean on the experts to share how they are leveraging metrics to make an impact in their organization.

76% use metrics to identify process bottlenecks.

Teams with Metrics Tracking

The vast majority (95%) of respondents are part of an in-house creative team that tracks specific metrics regarding impact and output of creative and marketing efforts.

2022-q4-creative-operations-report-In-House-Creative-Teams-Tracking-Impact-and-Output-Metrics
Sadie-Thomas

Sadie Thomas

Creative Marketing Manager at SportsArt Fitness

With nearly 15 years of experience designing for a wide range of companies with varying stages of brand awareness and identities, her creative strategy focuses on process, design principles, and attention to details.

When Sadie Thomas first started with SportsArt Fitness there was no project management or system in place to manage the creative work. Nonetheless, she knew it was important to track the work the team was doing, and to provide those metrics back to the organization.

For over five years, Sadie has been tracking design team metrics. She has gone from tracking manually to pulling reports from their creative operations platform. Last year, Sadie was promoted to Creative & Marketing Manager and now oversees both the design and marketing functions. She knew she was going to need to lean on metrics to show the tremendous amount of work the team was doing.

The first step in getting a full picture view of what her team was doing was to get the marketing function up and running in Lytho.

Up until that point, the core users were primarily the design team and the marketing team. The organization was not fully using Lytho to manage projects. Additionally, was some hesitation from the marketing team, but through some show-and-tell, Sadie was able to prove the value of the platform to her team. She did so by showing how building out projects and campaigns can give her the information to advocate for her team – showcasing the amount of work they produce.

As the marketing team got up and running in Lytho, they were able to pull reports that showed a full picture of their projects. The number of projects being completed remained relatively consistent but the number of tasks being completed grew by about 50%. Why? Because all the work the marketing team was doing for the project was now being accounted for.

The team has been evolving and trying to be more proactive for their stakeholders and better anticipate their needs. They are planning ahead and creating work independently, which has reduced the number of requests they are getting. Because of the metrics foundation that Sadie has built, she is able to show that the decrease in requests is a positive. This and she is able to show the amount of work her team is doing through tasks and projects.

As SportsArt’s needs expanded, they implemented Lytho DAM.

As they were onboarding and outlining their taxonomy structure, Sadie realized that there was a great opportunity to carry the tagging structure back into the workflow functionality. This gave Sadie a new angle on reporting – tags!

Year-over-year the metrics and reporting that Sadie puts together continues to evolve, but one thing remains consistent – the importance of reporting those metrics back to the organization. Through tracking metrics, Sadie has advocated for her team within the organization. She has used numerical data to demonstrate the result of the work the team produces.

Metric Tracking Advice:

  • Start by picking just one area or metric to start tracking
  • Add additional metrics over time

Favorite Metric:

Total Time Tracked

Leading and Lagging Metrics

2022-q4-creative-operations-report-Leading-Metrics-Tracked-By-In-House-Creative-Teams
2022-q4-creative-operations-report-Lagging-Metrics-Tracked-By-In-House-Creative-Teams
Erika-Ruiz

Erika Ruiz

Vice President of Creative at PPI Beauty

Erika has over 15 years of experience in consumer packaged goods (CPG), focusing on beauty and wellness. Centered within the in-house environment, she builds teams to create objective, quality work that delivers strategic branding initiatives to her business partners.

Ever since the very beginning, Erika has relied on Lytho’s Creative Operations Platform to stay on top of PPI Beauty’s 250+ items. When the conglomerate decided to unify its brands, their project management tools lacked the functionality she and her team needed to be successful “and the needs were really high”. Even worse, the in-house creative team she needed was, at the time, virtually non-existent.

With no-one but a couple of freelancers by her side, she set out to execute her vision for the newly merged beauty giant. A vital piece of that plan for Erika was to create a proper in-house team and arm them with the right processes and workflows so they can effectively collaborate with all external and internal stakeholders. In this way, they could finally meet their evolving and ever-changing business and creative needs.

At the same time, Erika needed full visibility and access to things like current bandwidth, as she wanted her team to retain control over their workload. With all that in mind, Erika advocated for Lytho’s solution once again. The response from her stakeholders was positive – they were impressed by Lytho’s dedicated product team, who work hard to keep the platform updated. The team is constantly adding new features to cover the needs of creative and marketing teams.

Lytho, Erika says, is the only creative operations platform that offers the right report visualization and routing capabilities she requires to ensure smooth operations and meet the demands of her stakeholders.

In her extensive efforts to support her team, she uses Lytho to track volume of work, time spent on tasks and projects, and the time her creative team spends on each retailer against results to determine the level of effort required.

By using the same time-tracking metrics, Erika can identify:

  • Which projects her team has completed
  • The ones they are currently on track for
  • And the ones they are behind on

In combining all the data Lytho’s platform provides, she could demonstrate how her creative team required additional resources to cope with the amount of work they had on their hands. The result? Her creative team was given the freelancers they needed!

The possibilities Lytho’s Creative Operations Platform offers are endless.

The tags functionality help Erika pull reports by brand and by category, which offers her the level of granularity she needs to pivot when necessary. Then, the mandatory custom fields she has required as part of the creative request process ensure she and her team always receive a minimum threshold of information with every request coming in.

Metric Tracking Advice:

  • Start small to get the feel of the information you actively use
  • Set up custom views to speak to the metrics you are really tracking
  • Audit the information you have in the system of currency and efficiency
  • Ensure your stakeholders can easily understand what you present to them

Favorite Metric:

Level of Effort

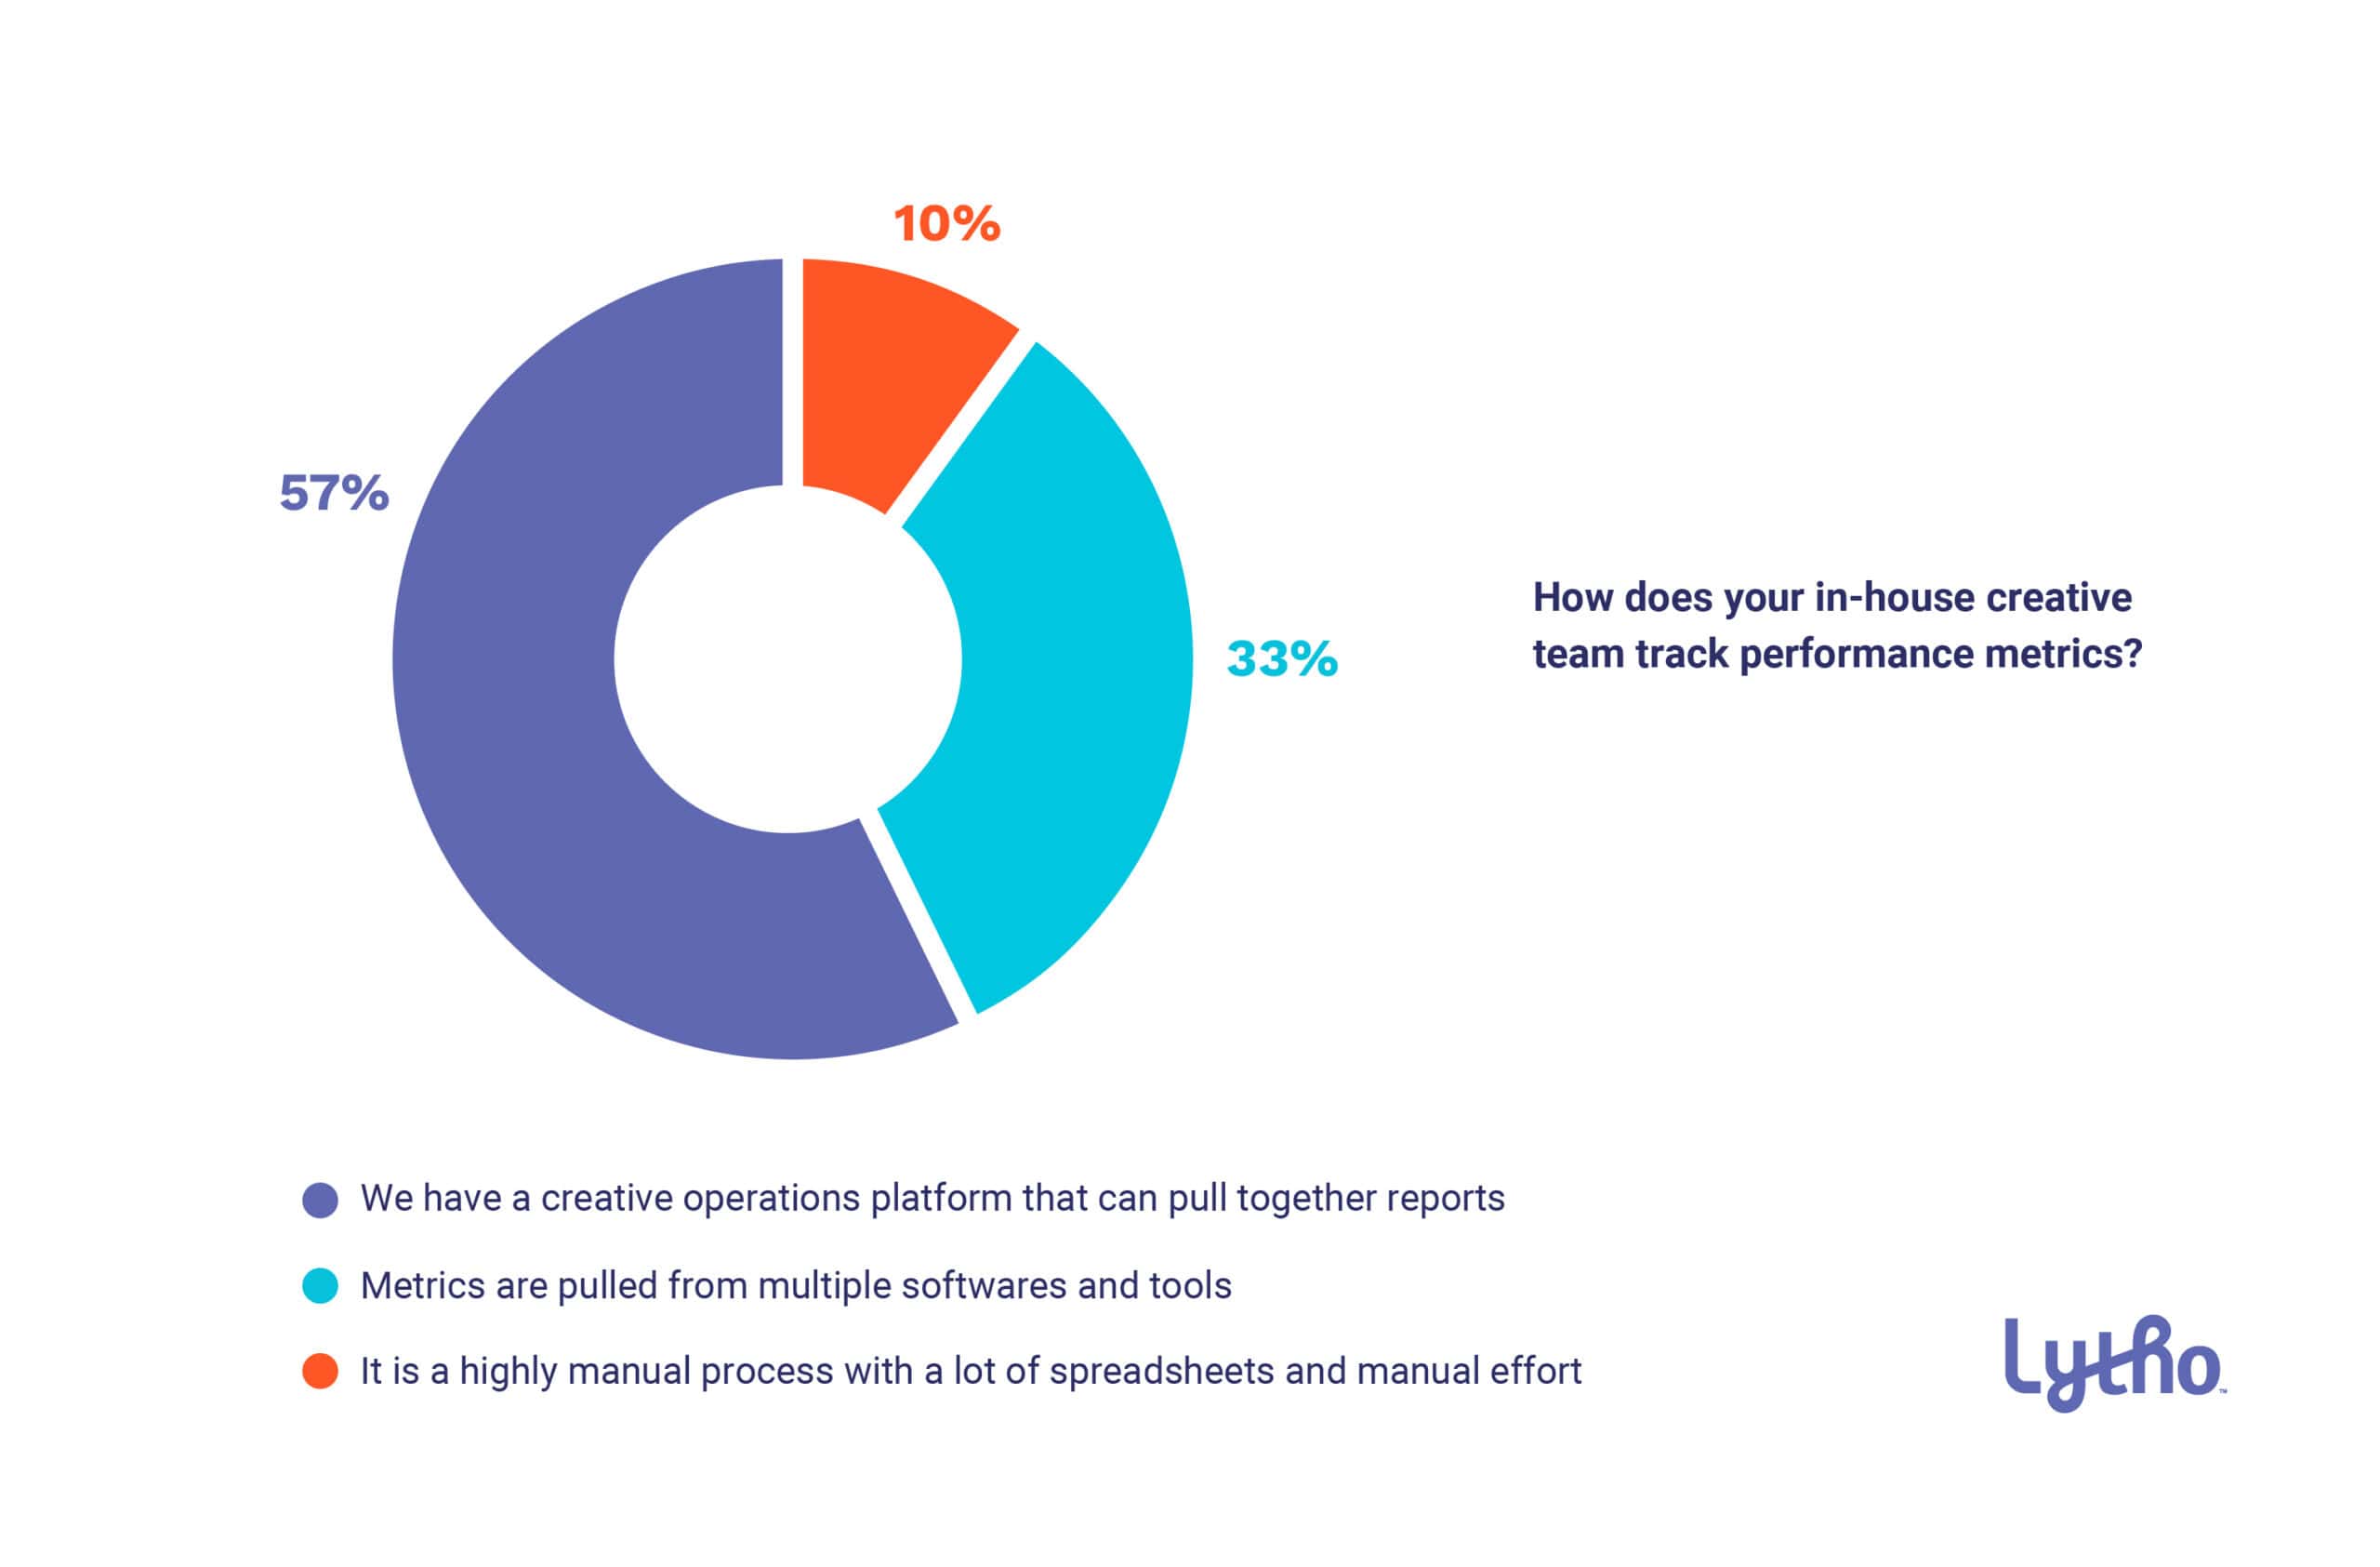
Data Input to Creative Operations Platform

2022-q4-creative-operations-report-How-Long-Have-In-House-Creative-Teams-Been-Tracking-Metrics

The vast majority of respondents’ teams have a reasonable level of familiarity with the tools they use. This enables them to track leading and lagging metrics.

2022-q4-creative-operations-report-Methods-For-Tracking-In-House-Creative-Team-Metrics
Mark-Tucci

Mark Tucci

Creative Service Manager, Community Transit

Mark has been designing and overseeing production of award-winning advertising and marketing campaigns for 20 years. Originally starting out as a radio DJ, he transitioned to the world of television and eventually fell into post-production work, producing and editing scores of TV commercials and promos before migrating to digital and print design, and eventually landing a role in marketing. After many years working in the cable industry, Mark joined the team at Community Transit in Everett Washington as their Creative Services Manager, where he leads a multi-talented group of artists and designers. During that time Mark has helped to mentor and uplevel the team’s in-house skills while overhauling their entire workflow process, which included onboarding and managing Lytho’s Creative Operations Platform.

When Mark started using Lytho, he immediately jumped at the opportunities that the creative operations platform offers. Mark oversees the creative services team – an internal group comprised of artists, designers, photographers, illustrators, and videographers who produce all creative assets for the in-house agency. This ranges from advertising and promotional collateral, vehicle graphics and wraps, to route maps, signage, employee-facing materials, and more. Since the team is primarily designers, they partner up with copywriters from the marketing and communications team on various projects.

“I am fascinated by the data that Lytho provides – with it, we can demonstrate our real value and what we bring to the organization.”

Internally, Mark uses the metrics to help build team morale. He does so by showing progress and improvements and celebrating with the team all they have accomplished. Externally, the metrics help him provide stakeholders with a comprehensive overview of what the marketing team has been working on. Mark uses a report that includes current projects broken down by their current status, as well as who the requester and requesting departments are.

This snapshot helps everyone understand the team’s current workload and bandwidth.

Lytho’s metrics allow Mark to predict highs and lows in productivity. Despite the atypical nature of the data captured during the COVID-19 pandemic, the team’s recorded output is now higher than ever in their third year of using Lytho. Mark strengthened his reporting with additional layers such as the level of effort and complexity for each project. This is how he gave everyone a better view of what’s happening. He assigns work by audience – adding priority to external-facing projects. Lytho also helps him track how much work was completed for a year-over-year analysis.

At the end of the year Mark pulls aggregate data on completion times, tracking projects completed ahead of schedule, on-time, and which projects were overdue when delivered. He uses the favorable data to further demonstrate the value his team brings to the organization. On the flip side, the very same data helps him pinpoint what went wrong with clear precision. By further breaking project segments down by completion time and complexity level, he tells stories that resonate with his stakeholders.

The metrics and data helped to structure review tiers in collaboration with stakeholders to improve workflow.

Leveraging Lytho’s Creative Operations Platform, Mark and his team have successfully narrowed down the number of reviewers needed, and the level of effort stakeholders must put into each project. The department has also continued to refine their request forms for additional clarity. Furthermore, they:

  • Tweaked the review prompt description
  • Added additional context within the review itself
  • Assigned a key decision maker to deal with and reconcile conflicting feedback scenarios

Mark’s metric mastery did not stop there. He used the Lytho data to determine which tasks were the most time-consuming, and where additional help might be needed. Given Community Transit’s public character and commitment to thoroughness, he has leveraged metrics in making the case for hiring a coordinator.

Saying that Community Transit has embraced Mark’s end-of-year metrics would be an understatement. By using Lytho’s extensive data pull, Mark has successfully transformed his creative team into an impressive paradox – a creative team that doubles up as the data champion of the organization.

Metric Tracking Advice:

  • For better or for worse, many people look at productivity as a measure of worth, advocate for the success of a particular deliverable instead

Favorite Metric:

Request Intake

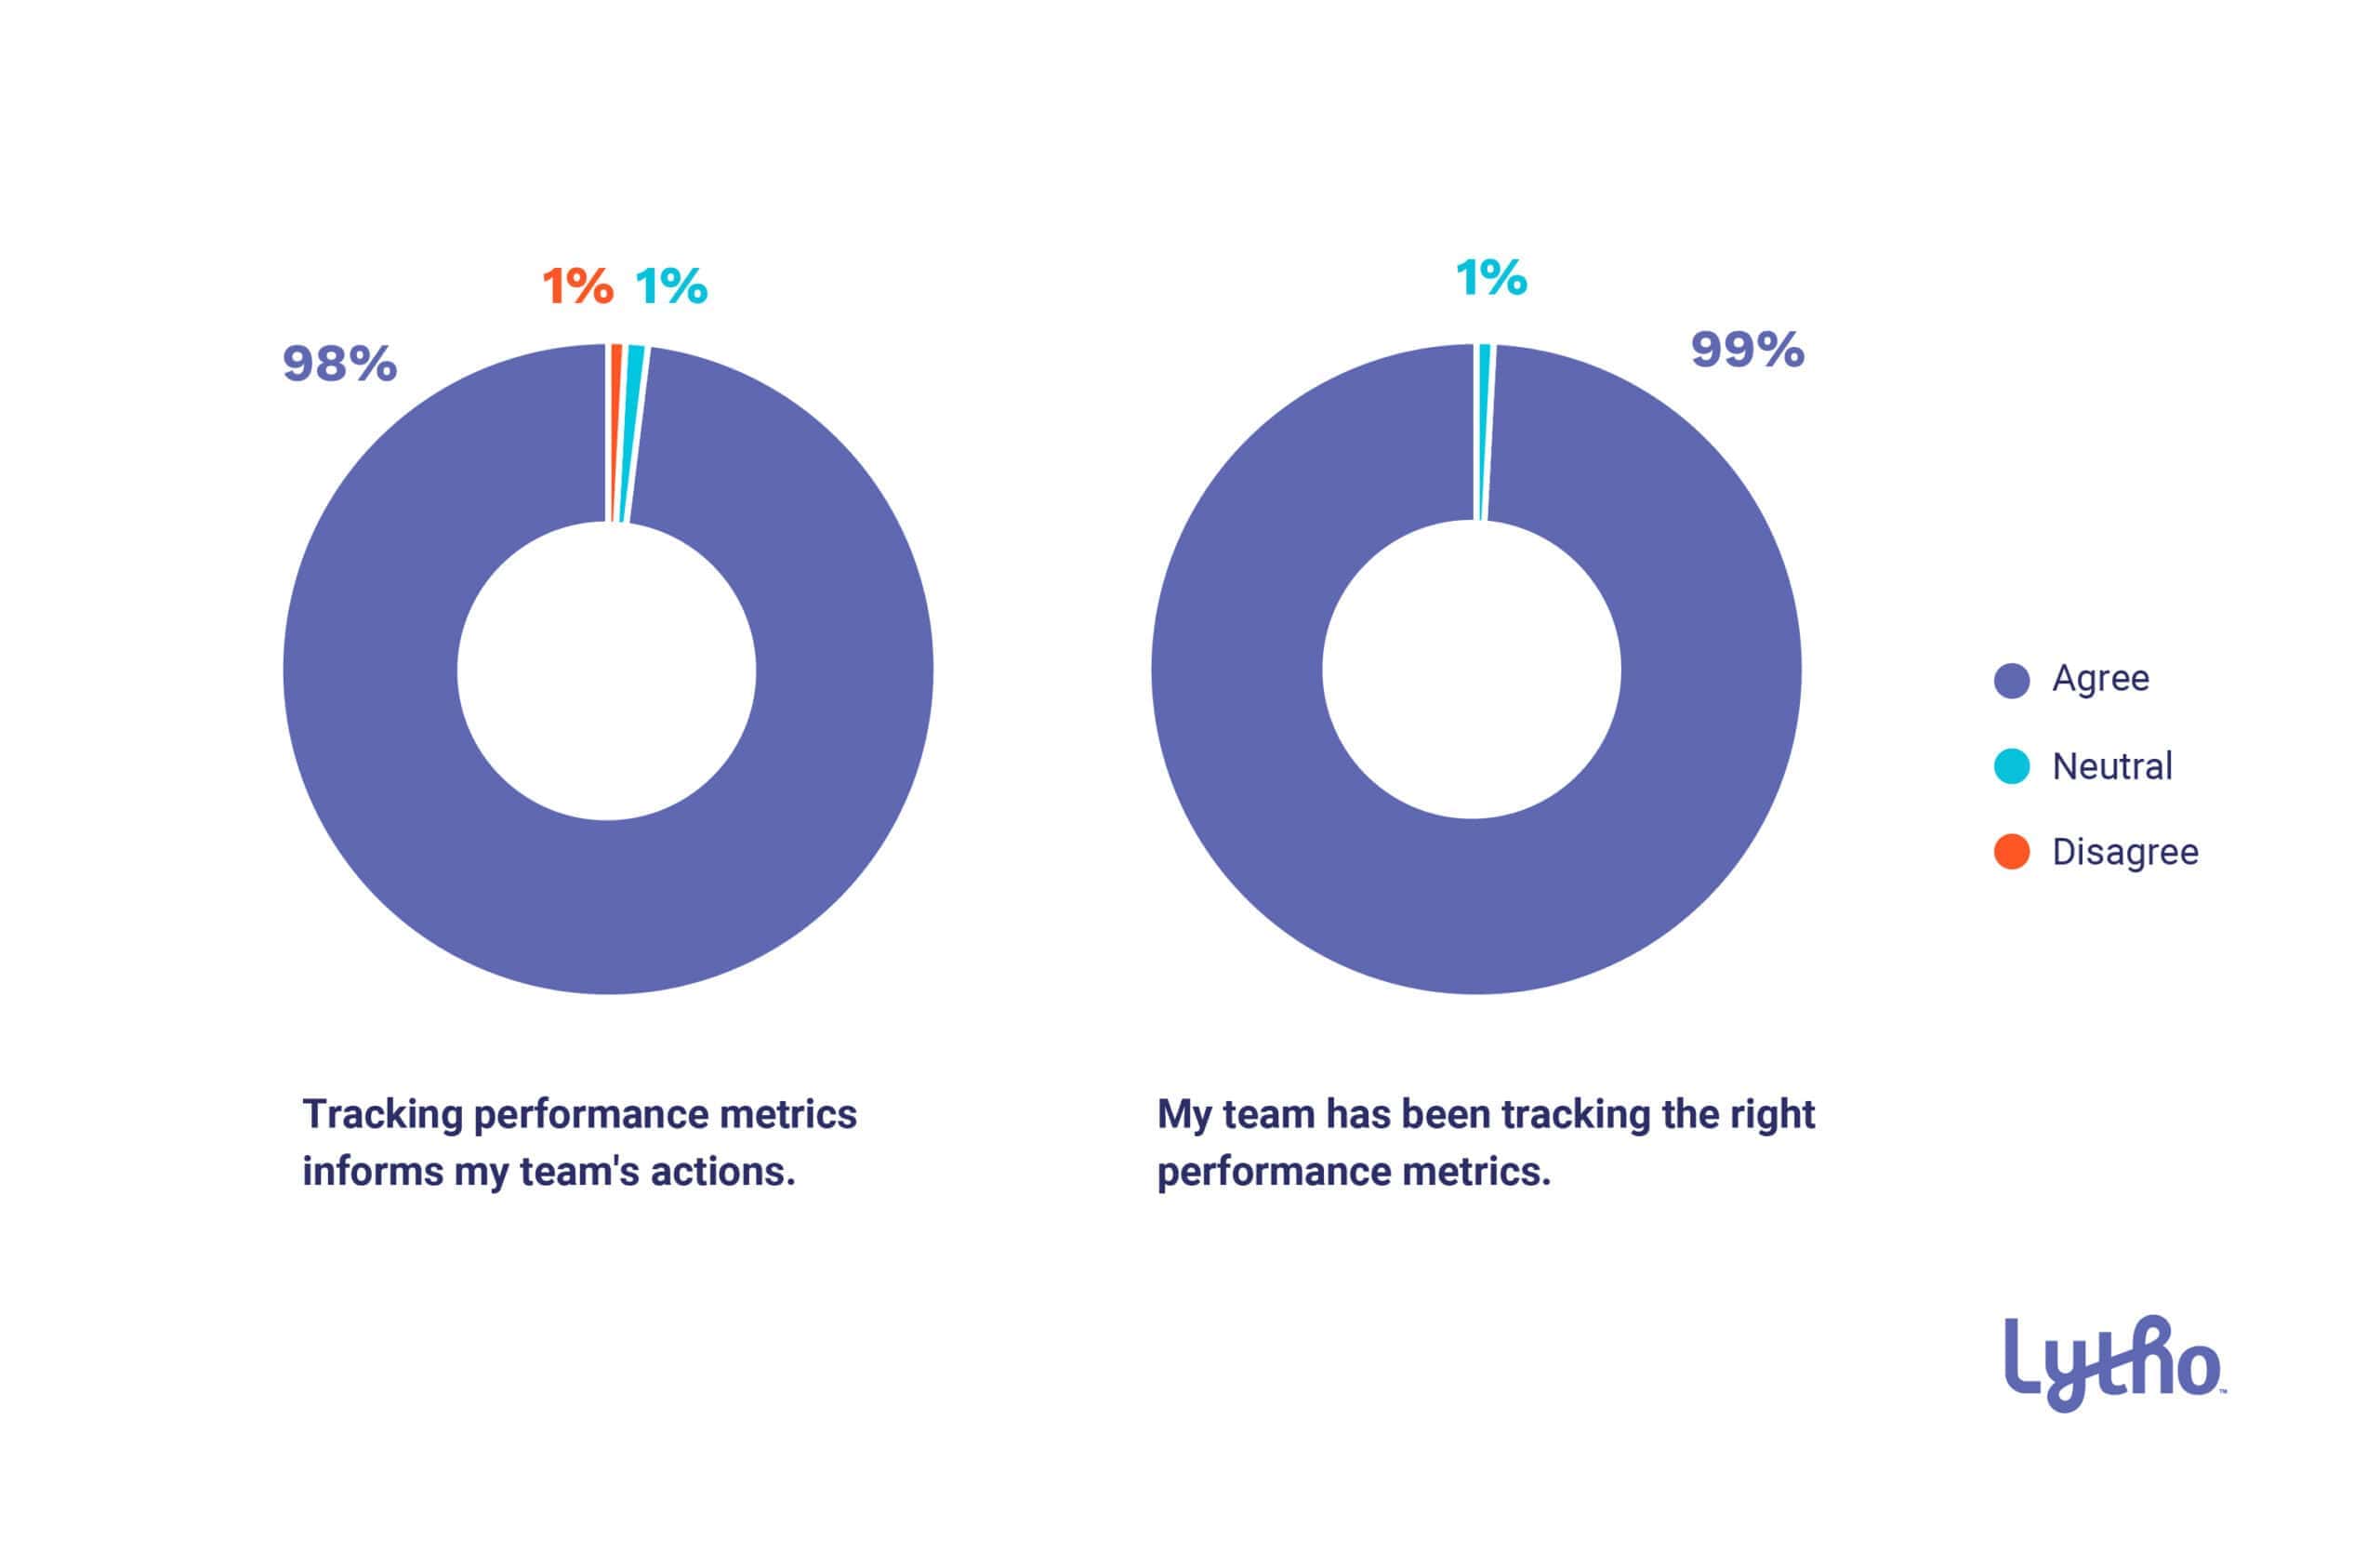
Evaluation of Metrics Tracked

Respondents are overwhelmingly satisfied with the metrics their teams are tracking and believe they are being used by their teams.

2022-q4-creative-operations-report-Satisfaction-Of-Metrics-Being-Tracked-For-In-House-Creative-Teams

Impact of Metrics on In-House Creative Teams

Improvement of workflow efficiency is the top impact metric respondents say their team is tracking.

2022-q4-creative-operations-report-Impacts-Of-Tracking-Metrics-For-In-House-Creative-Teams
Cherise-Oleson

Cherise Oleson

Senior Creative Director at Franklin Energy

As Senior Creative Director serving both Franklin Energy and AM Conservation Group, Cherise Oleson oversees creative projects for both corporate and utility clients. She leads a content and design team with broad capabilities and manages a diverse range of projects from the creation of logos to product packaging, program collateral, videos, online stores, reporting documents, and more. When she’s not working, she enjoys spending time with her family, singing or playing the piano, and playing games.

Cherise hit the metrics ground running, leveraging extensive reports for project management to keep everything on track from day one. Franklin Energy’s current structure means that her creative team sits under the wider marketing team. They receive creative requests from and send detailed reporting to the marketing team.

Lytho’s metrics have provided Cherise with no less than 321 reports that have been serving as one of the main drives behind the team’s ongoing restructuring.

One of the key metrics she tracked is internal corporate work vs client work – with the executive team paying close attention to both. For Franklin Energy’s leadership team, properly distributing time for internal and external work is crucial. Other reports, such as project types (email, direct mail, product packaging, etc.) were also highly important for the leadership team. They used them to guide their decision to restructure the marketing delivery team.

To that end, Cherise and other managers use status reports to distribute work evenly across team members. The reports also provide their teams with ongoing and valuable performance insights and feedback. This means they suffer fewer bottlenecks tied to a lack of performance visibility.

When asked to name the Lytho tool that brings the most value to Franklin Energy, Cherise pointed at Resource Management. The organization uses the Specialties functionality to view available members by specialization. They then identify the type of work sitting with each member at any given time using Workload View. In doing so, they can quickly assign work to available team members faster than ever before.

Metric Tracking Advice:

  • Start with how many projects are currently open and how many projects you and your team have completed this year. This always positively surprises stakeholders.

Favorite Metrics:

  • Volume of Work
  • Number of Projects Completed in a Year


Respondents’ Profiles

2022-q4-creative-operations-report-In-House-Creative-Team-Roles-and-Responsibilities
2022-q4-creative-operations-report-In-House-Creative-Team-Respondent-Profiles
2022-q4-creative-operations-report-In-House-Creative-Teams-By-Industry
2022-q4-creative-operations-report-Types-Of-In-House-Creative-Teams