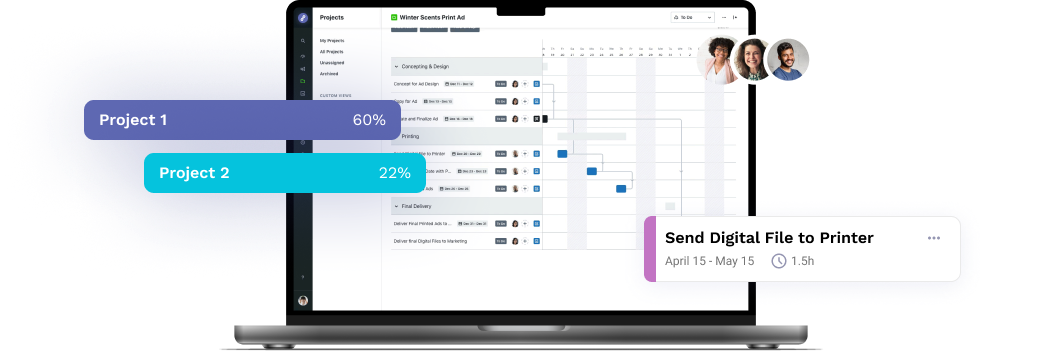
Often you need to spend money to make money — but proving it was money well spent can be tricky. Fortunately, we have just the tool to basically make your case for you. Your Work Dashboards in Lytho’s Creative Workflow have the data you need to showcase just how much you’re crushing it. Keep reading for everything you need to know about your Work Dashboards and ROI.
Pro tip: Bookmark this post so it’s handy the next time you have a budget convo.
What Do I Need to Know About My Work Dashboards?
Your Work Dashboards actually serve three — count ’em, three! — key purposes:
- Identify risks early to ensure work progresses without roadblocks. (We love an unobstructed workflow!)
- Prevent burnout by ensuring work is evenly distributed across the team. (We also love kicking burnout to the curb. It has no place here.)
- Tell the story of how your team works. (There is no shame in showing off their accomplishments.)
That third one is especially intriguing to us because it reflects how your team is supporting the greater company goals. The metrics in your Work Dashboards highlight how much time your team spends on tasks and which tasks are complete (or still in progress). By comparing this data to the KPIs of completed work, you can start to paint a picture of how your team supports the bottom line.
Let’s Break It Down
What’s on the to-do list? What’s completed? What’s in project purgatory? What’s blocked? (Even the most efficient teams face this challenge!) We’ve highlighted some of the key metrics from your Work Dashboards — and the important insights they provide.
Tasks completed
Yes, this one is pretty simple, but that doesn’t undermine its impact! Tasks completed shows your team is getting. it. done. With this metric at hand, everyone can see your contributions.
Average work duration
Have you decreased your team’s turnaround time? Or, conversely, do you need context for why only a few projects have gotten out the door? Average work duration can tell you a lot about which way your team’s time is trending. This metric is also particularly valuable in gut-checking your LOE. It’s a good practice to evaluate your LOE expectations versus actuals.
Work by status
Step on over to that list of “Complete” tasks and proofs. Feels good, right? It feels even better to show your stakeholders.
Work completed
See above. Additionally, seeing work completed over time unveils trends in workload, so you have a better understanding of your busy season(s) for better planning and forecasting.
All open work
This metric speaks for itself, but let’s underscore the value. Open work shows your team is booked and busy. You’re in demand. Other teams are seeing your value — and you’re delivering.
Time tracked on completed work
A slightly more granular way to dig into each team member’s impact. It’s crucial, especially in the context of a Very Big Important Project.
Um, No, Those Aren’t Dollar $igns in My Eyes …
But if they were, who would blame me? There is so much value represented in your Work Dashboards, and we can’t wait to hear how you leverage it.
Ready to unlock your business’s creative potential? Discover how Lytho’s innovative solutions can streamline your creative results management. Explore our features and schedule a demo today to see how we can transform your creative processes.
Do you want to give yourself and your creative team more room for creative stimulation by automating the boring stuff? Lytho helps you streamline your entire workflow and harmonize all brand collateral under a single, uniform platform. Feel free to reach out to us by scheduling a demo and learning how our creative solutions can boost the effectiveness of your creative projects. We look forward to speaking with you!

Ready to simplify your creative operations and start having a little fun at work again? Schedule time to talk with us.
Let us show you how Lytho’s Creative Operations Platform helps in-house creative and marketing teams do better work, ease the stakeholder experience, and stay on brand.
Schedule a Demo posted by